How to test our recently purchased hardware?


AIDA64 Extreme, Engineer and Business comes with diagnostic modules, which allow us to test the reliability or the performance of the whole PC or selected PC components. These can come in handy not only to test our existing hardware but also to check the condition of newly purchased devices.
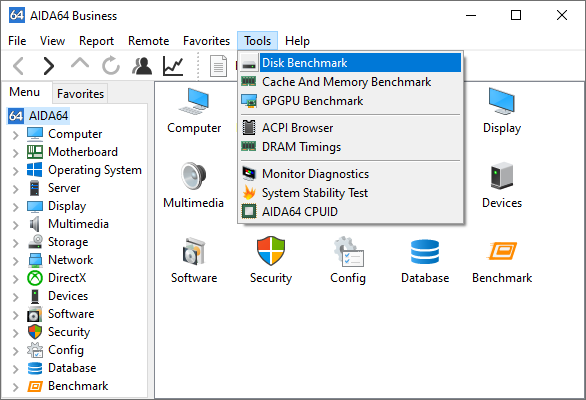
These hardware diagnostic tools are available under Tools in the main menu.
Testing HDDs, ODDs, USB keys, memory cards and SSDs
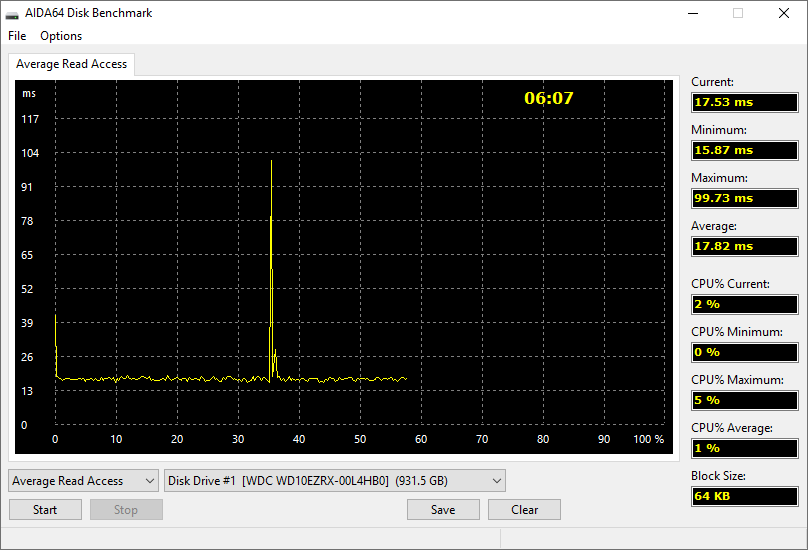
AIDA64 has a dedicated module for testing storage devices. This can be used not only for measuring their performance but also to detect any issues they may have. If we want to run benchmarks, we need to make sure to close all other processes running in the background in order to get accurate results.
We can use write test to detect hardware problems on storage devices. First, it is recommended to start with a random write test. If this provokes error messages we can locate the errors on the storage media using the linear write test. Using this test, we can also determine the true capacity of a fake USB key. If you want to read more about how to detect fake USB storage devices with AIDA64, click here.
Don't forget: write tests will delete all data from your device! This is why write tests are disabled by default: to enable them, go to Options in the Disk Benchmark menu bar.
The following tests are available in this module: Read Test Suite, Linear Read, Random Read, Buffered Read, Avarage Read Access, Max Read Access, Linear Write, Random Write, Buffered Write, Avarage Write Access, Linear Write + Verify, Random Write + Verify.
Does our new monitor/display work well?
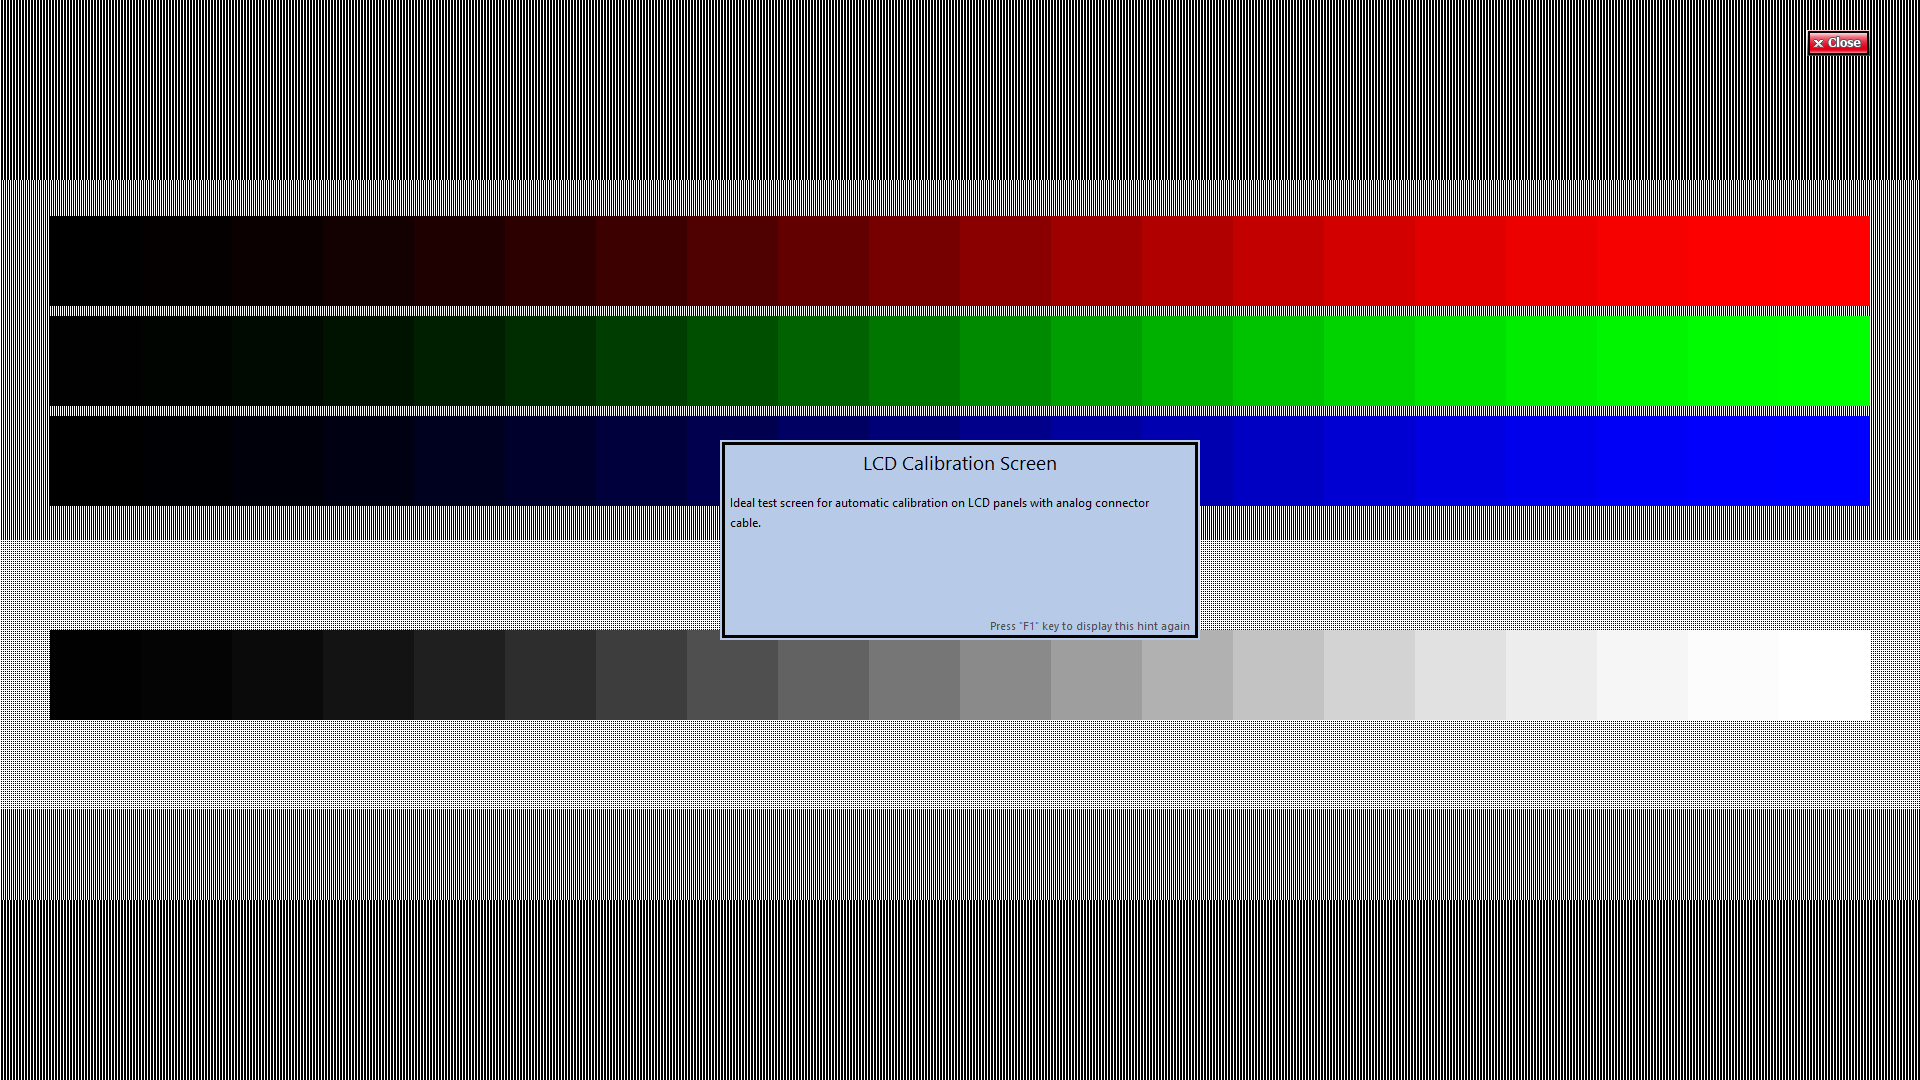
After purchasing a new monitor, we usually have a few days to replace it in case it has some defects so we better test it as soon as possible. AIDA64 Monitor Diagnostics can be used to check the capabilities and display performance of LCD and CRT displays. This module uses 45 different test screens to help us detect possible issues.
The tests are grouped under four main categories:
- Calibration tests
- Grid tests
- Color tests
- Reading tests
By hovering the mouse pointer over any individual test, we will be given hints as to the goal of the test as well as what we need to pay attention to. We can select which test or test groups we want to run, this way we can focus on specific issues instead of running all the tests.
The test can be run in automatic or manual mode. In automatic mode, the selected test screens will be displayed one after the other, as in a slide show, until Esc is pressed. In manual mode, we can proceed to the next test screen by pressing the Space or Page Down button. In this mode, hints are provided for each test screen regarding what we need to pay attention to. The module contains a predefined test setting for LCD displays, which can be selected in Selection / Test for LCD monitors on the menu bar.
In Preferences, we can choose to save the test selection upon exit in case we want to run the same tests next time.
We can also define how often the test screens should follow each other and we can select multi-display mode. On PCs with more connected displays, it is possible to test the monitors with the same test images on each or with a single test image stretched through all.
How does our PC perform under stress?
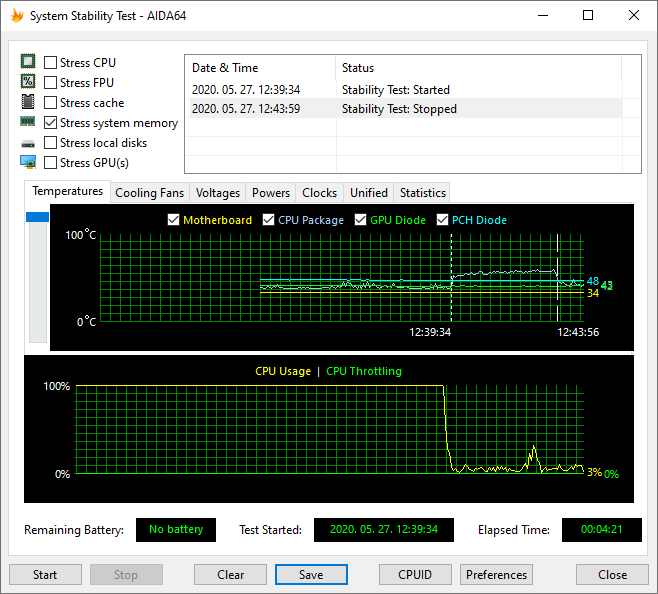
System Stability Test can be used to stress all major system components at once, and find any possible stability or cooling issues. Individual stress testing processes can be launched one by one or simultaneously, and can be enabled/disabled any time during the test.
In the log window, we can see when selected tests were started and stopped. On the graphs, we can monitor CPU usage and the temperature of selected hardware components. We can select various parameters we would like to monitor using the available tabs (Temperatures, Cooling fans, Voltages, Power). On the Statistics tab, a summary is shown with the minimum, maximum and average values indicated for all monitored parameters. The module also shows battery status (if applicable) as well as the date and time when the test was started and the time elapsed since.
The stress test can be started and stopped using the “Start” and “Stop” buttons at the bottom of the windows. By pressing the “Clear” button we can clear the graphs, while the “Save” button can be used to take screen shots of the window. It is possible to launch the CPUID panel from here and open the Preferences menu.