How to create an illustrated inventory for the management?


Depending on the number of items selected, our PC inventory may well be extremely detailed, containing a great deal of information that only sysadmins or other members of the IT staff may find useful or important. In the following, we will describe how to “mine” the information the management can be interested in from this mass of data, and how to present it in an easily digestible form.
Creating a list to be printed
First, let's select those 2 or 3 categories from the inventory, which are relevant for the decision makers. We can do this in Audit Manager.
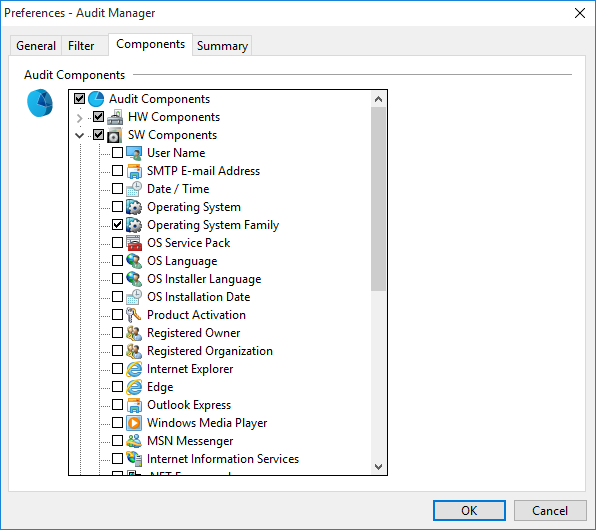
To get a clear, to-the-point list without unnecessary items, filter the content so that only the items required for the management report remain visible in Audit Manager. To do so, select the list called "List 4 (Computer)” then, in case the list has not been refreshed automatically, click “Refresh”.
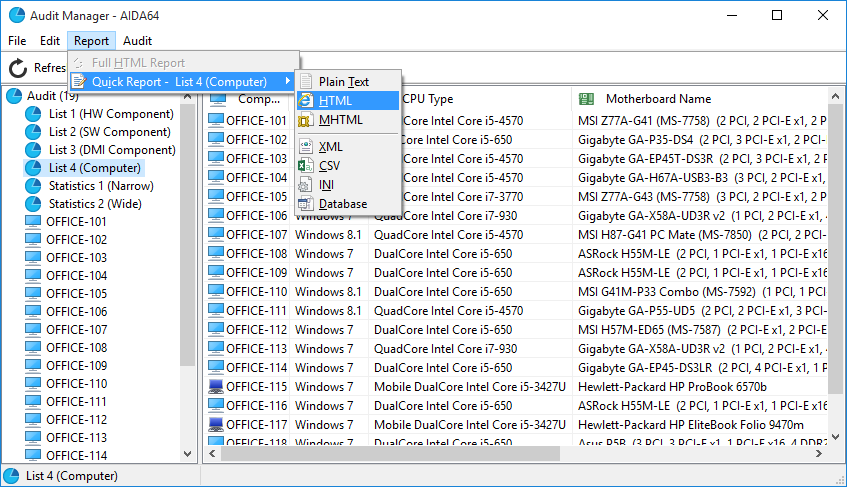
Now select Report / Quick report – List 4 (Computer) and, for example, MHTML, as it is the most "spectacular" yet simple report format.
After the report has been created, we will see its preview, which can be saved to a file, sent in email to any email address or printed.
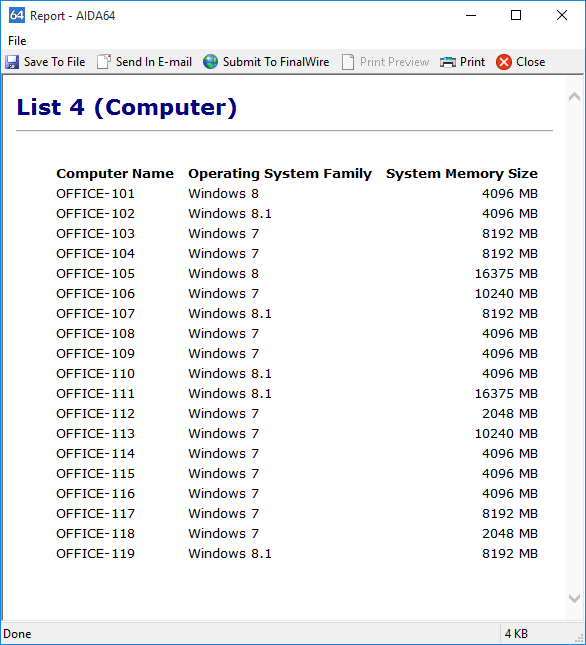
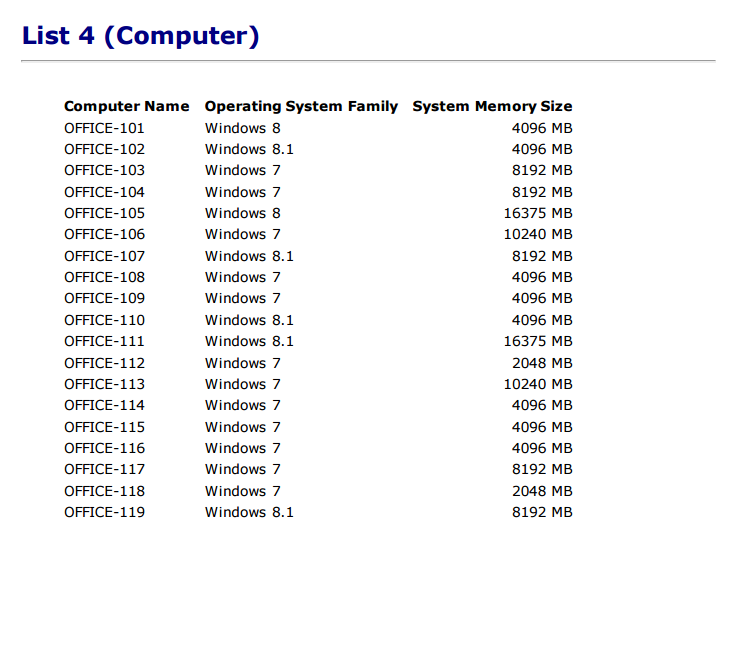
This is how the printed report will look like:
Creating diagrams
In Audit Manager, we can see a summary table of the whole PC fleet, showing the distribution of various components in the network. Using the table, we can determine how uniform or heterogeneous the hardware and software environment of PCs connected to the company network is. By right-clicking the name of the group of items, we can create diagrams to make the inventory report more illustrative.
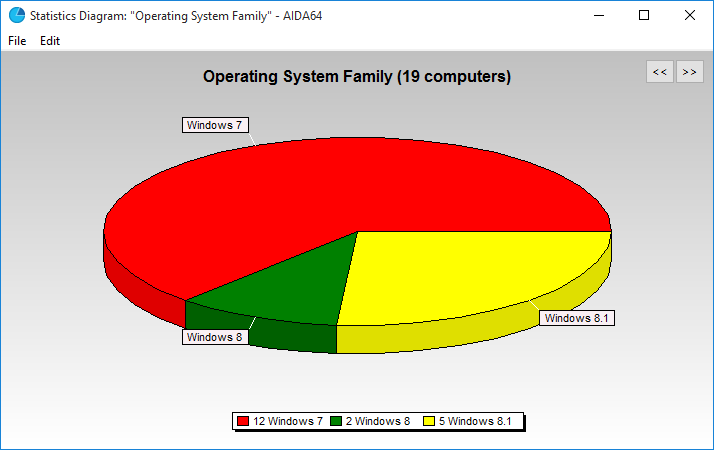
The above diagram shows the distribution of operating systems on the company network.