

How to create a fully customized SensorPanel in AIDA64?


AIDA64 Extreme, Engineer and Business support several ways to display sensor measurements on your desktop. Not only can it log all sensor values in a log file or make them available to external applications, but it can also display an OSD Panel in any Windows editions, a Sidebar Gadget in Vista and Windows 7, sensor icons in the Notification Area and, last but not least, a nice SensorPanel, too.
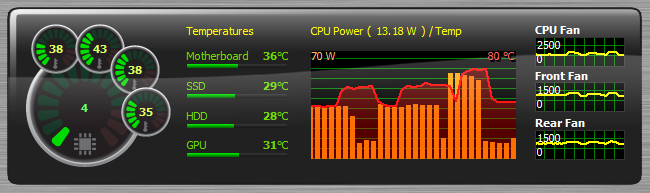
The SensorPanel is the one of the more spectacular monitoring modules AIDA64 offers. It has been designed with power users in mind, such users that prefer customizing every detail in both the layout and the set of displayed values. This is why it takes some time to come up with a nice panel like this:
But no worries! In this blog post, we'll provide you with instructions on how you can create your fully customized SensorPanel in AIDA64.
1) The first step is to enable the SensorPanel (File / Preferences / Hardware Monitoring / SensorPanel / Show SensorPanel).
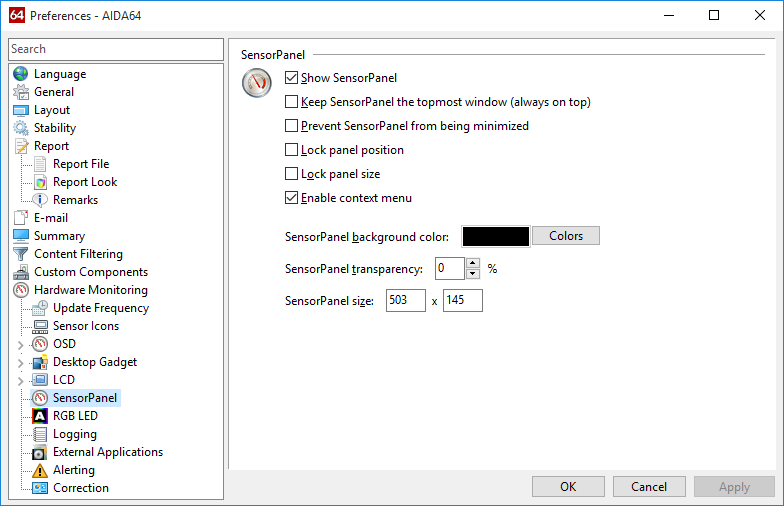
2) We are going to use a 500x145 pixel background image we have designed. As we know the image dimensions, we can set the SensorPanel size in Preferences. In this settings window, there are several other options you can choose from.
AIDA64 currently does not support transparent backgrounds: you can either use a solid color background or a nontransparent background image of your choice. But there's a trick: if you want your SensorPanel to look as if it were transparent on the Windows desktop you can cut out a section of the desktop background image and use it as a background image in your SensorPanel. Then all you need to do is position the SensorPanel to the same area on the desktop which you cut out before.
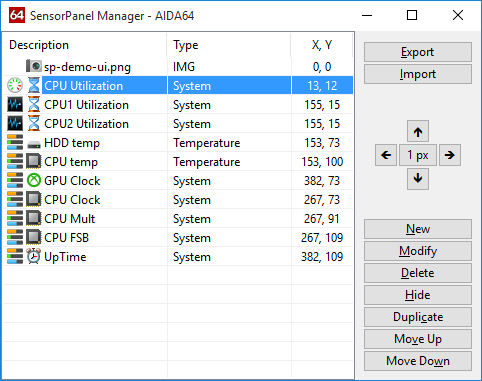
3) Now let's switch to the SensorPanel. We can access the SensorPanel Manager by right-clicking on the panel area. In the Manager, we can see the list of items used/displayed on the panel. As we want to create a fully customized SensorPanel, let's delete all default items.
4) Now let's add the background image to the blank panel. To add an image, click on “New”, then select “Image” from the drop-down menu, browse to the file's location, and click OK.
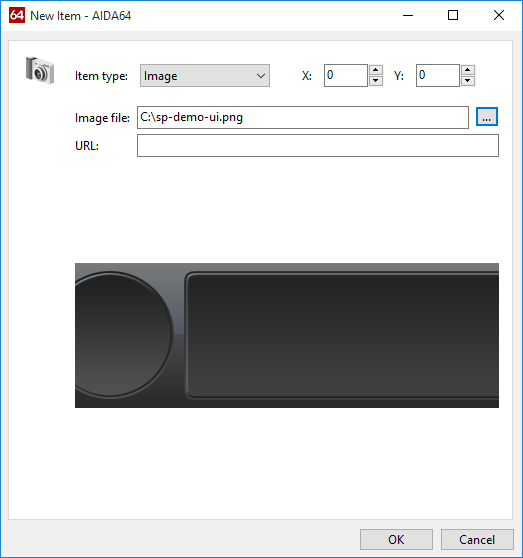
Hint: you can add any image to the SensorPanel this way, and set its position on the panel by specifying the X and Y coordinate values. But you can also position any item on the panel by selecting it in the SensorPanel Manager list and using the arrows on the right.
Note: currently, most configuration windows in SensorPanel Manager are available in English only.
5) Now we are going to populate the blank panel with sensor items: first, a gauge indicating CPU Utilization. Let's select “New”, then “Gauge” from the “Item type” drop-down menu, then “CPU Utilization” from the list. We can customize the gauge by selecting the size, color, label, font type etc. we want to use.
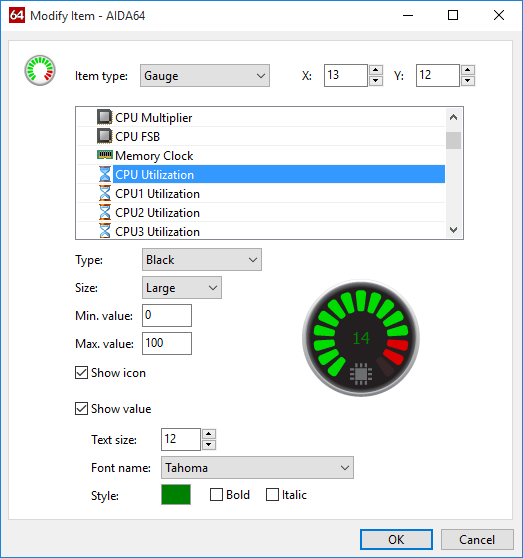
AIDA64 gives you the opportunity to change the color of the gauges in the drop-down menu “Type” (available options are black or white). However, if you are not satisfied with the look of the default gauges, and you are not afraid of using Photoshop or other photo editing software either, you can create and use custom gauges or indicators as well. To do this, you fist need to draw all the 15 possible indicator states and upload them one by one in AIDA64, then select Custom in the Type menu, and then click on the “States” drop-down list. (You can download the default AIDA64 gauge states from here. Feel free to modify them!)
Again: you can position any item on the SensorPanel by entering the exact X:Y coordinates on the item preferences page, or by selecting it in the SensorPanel Manager list and using the arrows on the right.
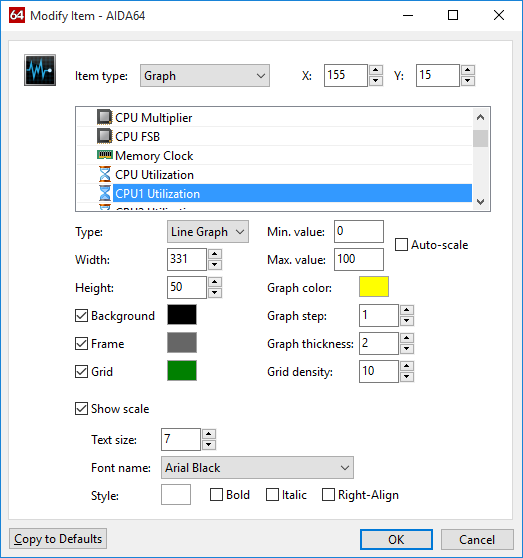
6) Adding a graph works just like that. For example, if you want to display the utilization of CPU Core 1 in a graph, all you need to do is click “New”, then selecting “Graph” from the “Item type” drop-down menu, and then selecting CPU1 Utilization. You may need to set the min and max threshold values for the graph, but in this case the default 0 to 100 range is just fine. You can now position the graph and define its width and height as you wish. There are a couple of other things you can customize, including background color, grid color, graph line color and thickness, label font etc.
Now, if you want to see all utilization for all CPU cores on the same graph, all you need to do is duplicate the first graph, for example, three times if you have a 4-core CPU, and then modifying the newly created graph items and selecting the appropriate CPU core for each (eg. CPU2 utilization for the 2nd item and so on...).
If the grid lines are not in sync on the overlaying graphs, turn off the grid in each newly added items.
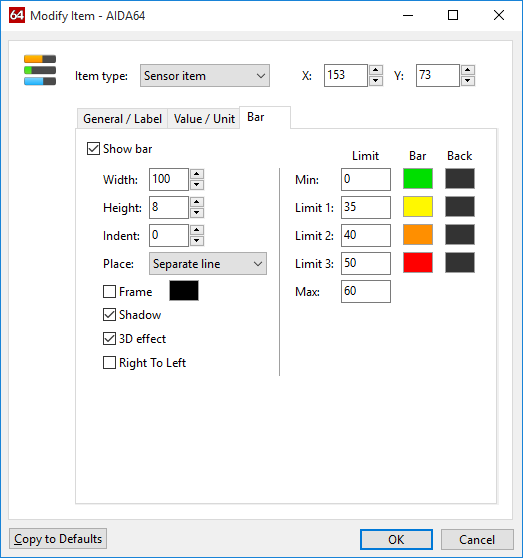
7) The same way, you can add further items, like further graphs, bars, text and images to the panel. There are a couple of options available for each: for example, you can set the min and max values for each item. Or you can set the threshold values when the color of the bar should change, eg. from green to yellow and then to red as the CPU or GPU is getting hotter. In the latter case, bear in mind that you need to set the color thresholds in such a way that they match the characteristics of the monitored hardware as 60 Celsius may be absolutely normal for a GPU, while it is way too high for a HDD.
Hint: if you want to use more SensorPanel items of the same kind (gauge, graph), customize the first and then duplicate it as many times as required.
Hint: you can modify the settings for multiple items at once if you select more items and click on “Modify”. If you do so all modifications will be marked with a vertical red line in the settings window.
Hint: You can also display whatever labels you want for each sensor item. It's recommended to change the default label which is usually too dull and too long. :)
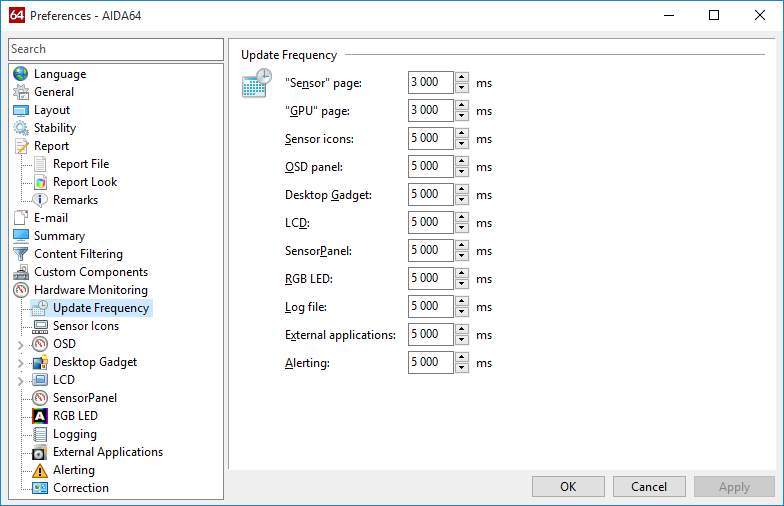
8) In Preferences / Hardware Monitoring / Update Frequency, you can set how often AIDA64 updates the sensor readings. If you want a really dynamic SensorPanel, set the update frequency to 1 second or less, instead of the default 5 seconds.
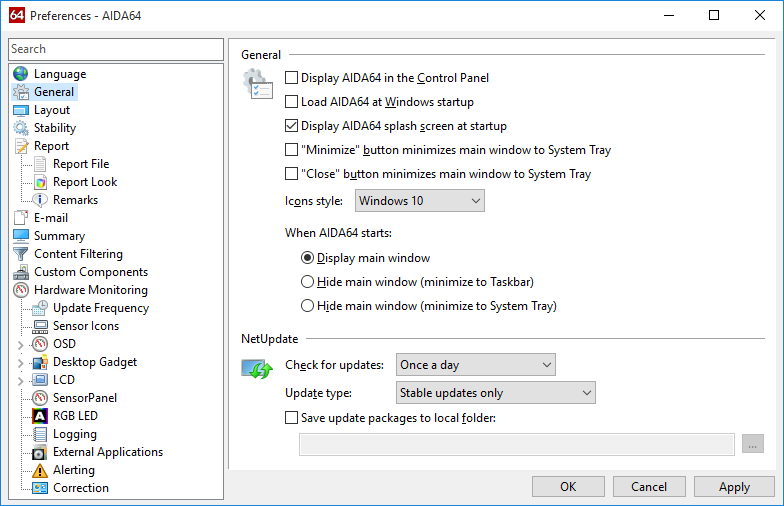
9) Now that your customized SensorPanel is ready, it is time to decide if you want to load and display it when Windows starts. If so, all you need to do is go to File / Preferences / General and check both “Load AIDA64 at Windows startup” and “When AIDA64 starts Hide the main window (minimize to System Tray)”. This way AIDA64 will launch at Windows startup and display the SensorPanel without loading the main program Window. This can also be displayed any time by clicking the AIDA64 icon in the notification area.
You can see all these steps in action in our instructional video.
You can download the complete SensorPanel and the background image we used in the video from the following link. Feel free to experiment with them!
Please bear in mind that the SensorPanel (just like the OSD Panel or the AIDA64 desktop gadget) will not be visible when playing full-screen 3D games or full-screen video even if “Keep SensorPanel the topmost window (always on top)” is selected. If you want to display hardware monitoring readouts during gameplay or video playback, you can use the latest and greatest RemoteSensor feature, an external LCD, a second monitor, the RivaTuner export option, or use sensor value exporting.